
How-To & Tutorials
Core Web Vitals Field Data: How to Test What Real Visitors Actually Experience
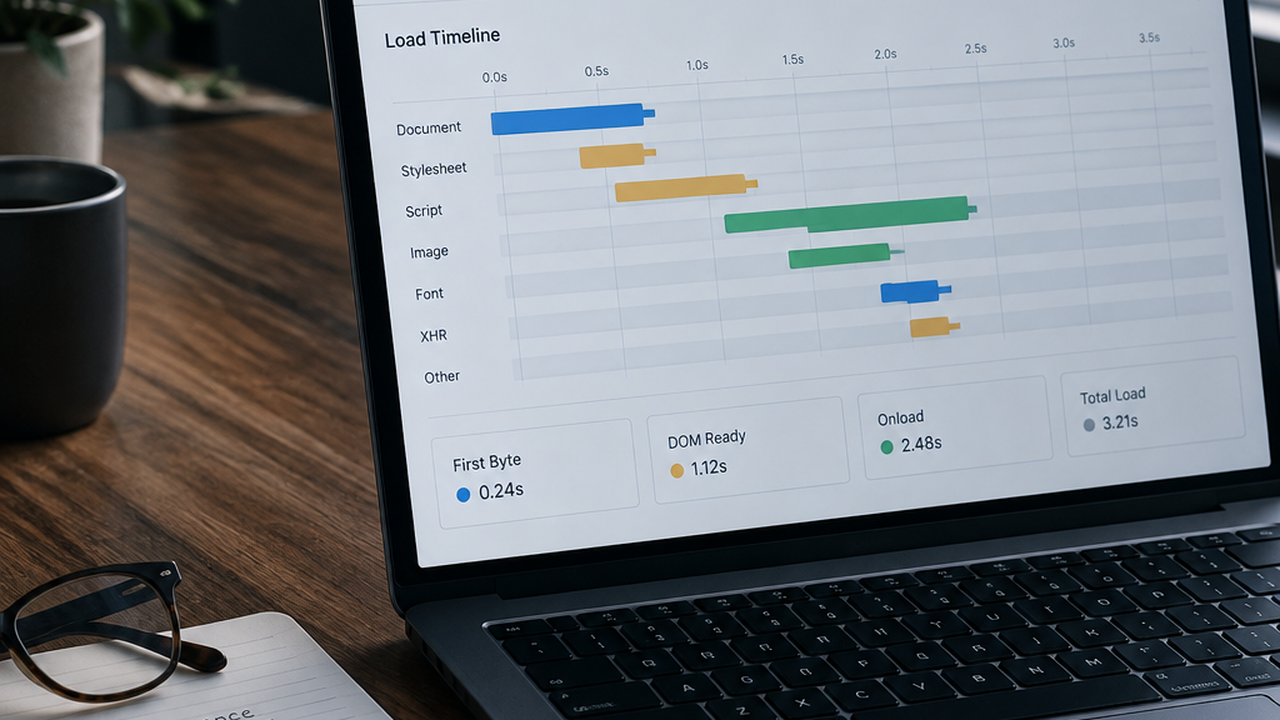
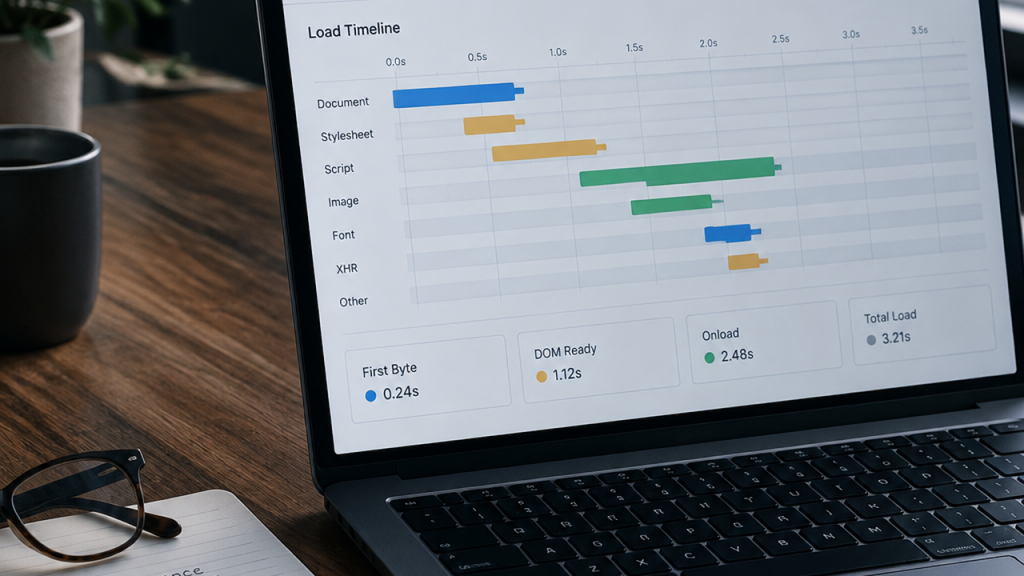
There is a specific kind of disappointment that comes from shipping a page with a green Lighthouse score and then watching a client in Toronto say the site feels slow. Nothing was broken. The audit was measuring a different website than the one your visitors load: a lab run, on simulated hardware, from one location, with an empty cache and no ad blocker, no consent banner, no third-party chat widget, and nobody scrolling with their thumb while waiting for a bus.
Core Web Vitals field data is the fix for that gap. It is the number Google actually uses for page experience signals, and more importantly it is the number that describes your real audience. This tutorial walks through how to pull that data, how to read it without fooling yourself, and the order of repairs that moves it. Every step below can be done in a browser tab and a spreadsheet, no paid tool required.
Why the Green Lighthouse Score Is Not Evidence
Lighthouse runs one page, once, in a throttled simulation, usually on a fast developer machine, usually from a server location near a data centre. That setup is useful for finding code-level problems, but it is not a measurement of your visitors. Three things break the comparison before you even start:
- Device mix. A lab audit assumes a mid-tier phone profile. Your actual traffic might be 78 percent mobile mid-range Android, or 90 percent desktop depending on the niche. The score doesn’t know, and neither will you unless you look.
- Consent and third parties. In the EU and UK, analytics and marketing scripts often load only after consent, so a lab run that blocks cookies sees a page your consented visitors never see.
- Geography. A page hosted in Frankfurt with visitors in Vancouver is a 130 millisecond round trip before a single byte of content arrives. No amount of CSS minification fixes distance.
So treat a lab score as a diagnostic instrument, not a verdict. It tells you what is expensive in your code. Field data tells you whether that expense is landing on anyone’s screen.
Lab Data and Field Data: What Each One Can and Cannot Tell You
Both instruments measure the same three metrics, but they answer different questions. Keep the distinction straight and most performance arguments dissolve:
| Question | Lab data (Lighthouse, WebPageTest) | Field data (CrUX, real user monitoring) |
|---|---|---|
| Who is measured? | One synthetic run on simulated hardware | Real visitors, real devices, real networks |
| How fresh? | Whatever you just ran | Rolling 28 days, refreshed daily in the public dataset |
| Is it segmentable? | Only per test configuration | Yes: device type, country, page group, connection |
| Does it catch a regression? | Immediately, if you run it | Slowly, because 28-day averages damp sudden changes |
| Best use | Finding the cause and testing a fix in isolation | Deciding what is worth fixing and proving it worked |
Notice the last row of that table. A 28-day rolling window means a bad release on the 1st is still visible on the 25th, and a good release today won’t show fully for a month. That lag is the single most common reason people conclude “the fix didn’t work” when it simply hasn’t aged into the data yet.
Step 1: Pull Your Field Data Before Touching Any Code
Your baseline needs to exist before your changes do, otherwise you have no comparison and no defence when someone asks whether the work helped.
- Check coverage in PageSpeed Insights. Enter the URL and read the “Discover what your real users are experiencing” block. If it says the URL has insufficient data, the public dataset has no sample for that page, which is common below roughly a thousand monthly views per page.
- Fall back to origin level. The Chrome UX Report API lets you query by origin instead of URL (
https://chromeuxreport.googleapis.com/v1/records:queryRecord, free API key). Origin-level data aggregates every page on the domain, which is crude but honest. - Go private if you need page granularity. A real user monitoring script (the free tiers of Cloudflare Web Analytics, Vercel Speed Insights, or a self-hosted web-vitals snippet) collects your own sample within days, and lets you segment however you like.
- Save the export. Screenshot or CSV the 75th percentile LCP, INP and CLS for mobile and desktop separately, dated. That is your baseline document.
If you sell this work to clients, put the baseline in the project folder next to the brief. A dated before-and-after with the same instrument is far more convincing than any score you can quote later.

Step 2: Read the 75th Percentile Properly
Core Web Vitals field data is reported at the 75th percentile: the value that three quarters of your visits beat. That definition has consequences people routinely miss.
- It is not an average. A handful of extremely slow visits do not drag it down the way a mean would. Instead, the whole number shifts when you fix the slowest quartile, which is why fixing the worst experience beats shaving milliseconds off the median.
- Passing thresholds are all-or-nothing. Good means LCP under 2.5 seconds, INP under 200 milliseconds, CLS under 0.1, each at the 75th percentile. Two green and one red is still a failed page group.
- Segments can hide each other. Desktop passing at 2.1 seconds does not mean mobile is fine at 4.6. Always split by device before celebrating.
- Geography matters for LCP, not just for hosting. Averages across the US, Canada and the EU blur the difference between a visitor 40 ms from your CDN edge and one 200 ms away.
Practical habit: build a two-column sheet, mobile and desktop, with the three metrics, the segment, and the date. Anything you cannot fill in is a place where you are guessing.
Step 3: Find the Slowest Element, Not the Slowest Page
LCP is caused by exactly one element per page view: the biggest image, video poster, or text block in the first screen. Fixing the page in general is wasted effort if that element is a 900 KB hero image served at full desktop width to a phone.
- Identify the LCP element. In Chrome DevTools open the Performance panel, record a page load, and look at the Timings track. The LCP marker names the node. Do it at 390px width, not desktop.
- Check what delays it. Broken into four parts: time to first byte, resource load delay, resource load time, and element render delay. A hero that loads fast but renders late usually means a render-blocking font, a lazy-loaded image above the fold, or a client-side framework hydrating before paint.
- Fix the boring things first. Serve the hero through
srcsetwith a mobile-sized source, addfetchpriority="high"andloading="eager", preload the font actually used above the fold, and stop lazy-loading anything in the first viewport. This single combination resolves a large share of failing LCP cases. - Then look at INP. Interaction to Next Paint is about main-thread work during clicks, not load speed. Long event handlers, third-party chat widgets, and huge hydration bundles are the usual culprits. Chunk the work, defer non-visual scripts, and audit every widget you embedded three years ago.
Step 4: Repair in the Order That Moves Field Numbers
Not every performance fix changes field data. Some only move lab scores. This is the order we work in, judged by what has actually shifted the 75th percentile on real sites:
| Fix | Metric it targets | Typical field effect | Effort |
|---|---|---|---|
| Right-size and prioritise the LCP image | LCP | Large; often 0.5 to 1.5 s | Low |
| Move hosting or CDN edge closer to the audience | LCP, TTFB | Large for distant audiences | Medium |
| Remove or defer obsolete third-party scripts | INP, LCP | Often large, especially chat and heatmap tools | Low |
| Reserve space for banners, embeds and ads | CLS | Near-total for layout shift | Low |
| Split and defer long JavaScript work | INP | Moderate to large on interaction-heavy pages | High |
| Micro-optimising CSS and icon fonts | All three, slightly | Small or none in the field | Medium |
Work top to bottom and stop when the numbers pass. The bottom row is where most audit-driven projects spend their time and get the least return, which is exactly why the order matters more than the checklist length.
Step 5: Run a 30-Day Recheck Without Fooling Yourself
Field data is a slow instrument, so the recheck needs discipline:
- Fix the measurement date, not the memory. Note the ship date. Wait 28 days minimum before judging, and mark the dashboard so nobody panics at week two.
- Compare like with like. Same instrument, same segment, same page group, same 75th percentile. Mixing a CrUX export with a Lighthouse run is not a before-and-after.
- Segment by device and country. A mobile-only improvement can vanish inside a blended average. European visitors on a US-hosted origin will move for different reasons than local ones.
- Watch for seasonal traffic shifts. A campaign that brings in more low-end Android traffic can make a fixed site look worse than it is. Note campaign windows next to the numbers.
- Keep a rollback note. If a fix that looked good in the lab pushed INP up in the field, you want the previous configuration documented well enough to restore in minutes.
Do this and you end up with something rarer than a performance score: evidence that a specific change helped a specific group of visitors. If you run client sites, that evidence is also the deliverable. It is the same discipline we apply to deployments in our staging to live launch checklist, where the goal is always measurement before and after a change, not a score on a badge.
Step 6: Know When Field Data Will Not Move
Sometimes you do everything right and the number barely shifts. Before you keep digging, rule out these five causes:
- Your sample is dominated by one heavy page. Origin-level data blends a fast blog with a slow checkout. Segment by page group before diagnosing.
- Third-party consent flows are the bottleneck. A consent management platform that blocks rendering, or a tag manager that waits on a network call before showing content, adds seconds that no image optimisation recovers.
- The delay is upstream. If your origin sits behind a slow database render, no front-end work beats it. Measure TTFB separately from front-end metrics.
- You fixed the wrong viewport. A mobile fix that never triggered because the theme swaps images via JavaScript after load is a fix on paper only.
- The window simply hasn’t caught up. Two weeks in, you are looking at roughly half real improvement and half older, slower data.
One more piece of housekeeping: field data for US, Canadian and EU audiences now depends heavily on consent choices, so your sample can shift for reasons unrelated to performance. If your analytics traffic drops 30 percent after a consent banner change, the metric denominators changed too. Mention it in the report rather than pretending the improvement was universal. The same reasoning shows up in our guide to email deliverability for freelancers, where opaque third-party filtering punishes anyone who skips the boring verification steps.

The short version of this whole tutorial: measure the audience, fix the single element that delays the largest content, remove the scripts you stopped using, reserve space so nothing jumps, and give the data a month to speak. Lab scores are a compass. Field data is the ground you are standing on.
FAQ
What exactly counts as Core Web Vitals field data?
It is aggregated measurement from real Chrome users: Largest Contentful Paint, Interaction to Next Paint and Cumulative Layout Shift, reported at the 75th percentile over a rolling 28-day window. The public version is the Chrome UX Report; a private version is any real user monitoring script you install yourself.
Why does my page have no field data at all?
Usually because the URL gets too little traffic to meet the minimum sample size. Query the whole origin instead of the single page, or install your own measurement so you control the sample and the retention.
How long after a fix should I expect the number to change?
Assume 28 days for public field data to fully reflect the change, with gradual movement from week two. Private real user monitoring can show a signal in a few days if you have enough traffic, which is why it is worth having both.
Is a good Lighthouse score still useful?
Yes, as a diagnostic. It isolates what is expensive and lets you test a change quickly without waiting a month. Just never present it as proof that real visitors are having a fast experience.
Does hosting location really matter if I use a CDN?
Less than it used to, but yes. A CDN shortens the trip for static assets, while dynamic requests still reach your origin. Visitors several thousand kilometres away feel that difference on the first byte, which delays everything after it.
Can I improve field data without touching the code?
Partly. Removing unnecessary plugins, disabling unused third-party embeds and switching to a host with better routing are configuration changes that often move LCP and INP more than a week of code refactoring. Start there before rewriting templates.